
- #China
- #Economy & Trade
- #North Korea
▶ Decline in Trade Volume and Diversity: Despite China's dominance in North Korea's trade, bilateral trade volumes have declined post-COVID-19 and have yet to recover to pre-pandemic levels. The number of traded commodities has also decreased, with North Korea exporting and importing fewer products compared to 2018–2019.
▶ Reliance on Low-Value Processing Trade: North Korea’s export growth has been driven primarily by wigs, a low-value processing trade. This reliance on narrowly focused industries highlights North Korea's limited industrial diversification and economic capacity.
▶ Geopolitical and Economic Frictions: Reports of stricter border controls and worker repatriation by China suggest potential friction in Sino-North Korean relations. While other factors like sanctions, China's economic slowdown, and North Korea’s efforts to address trade deficits may also explain the decline, the bilateral economic relationship remains weaker than before.
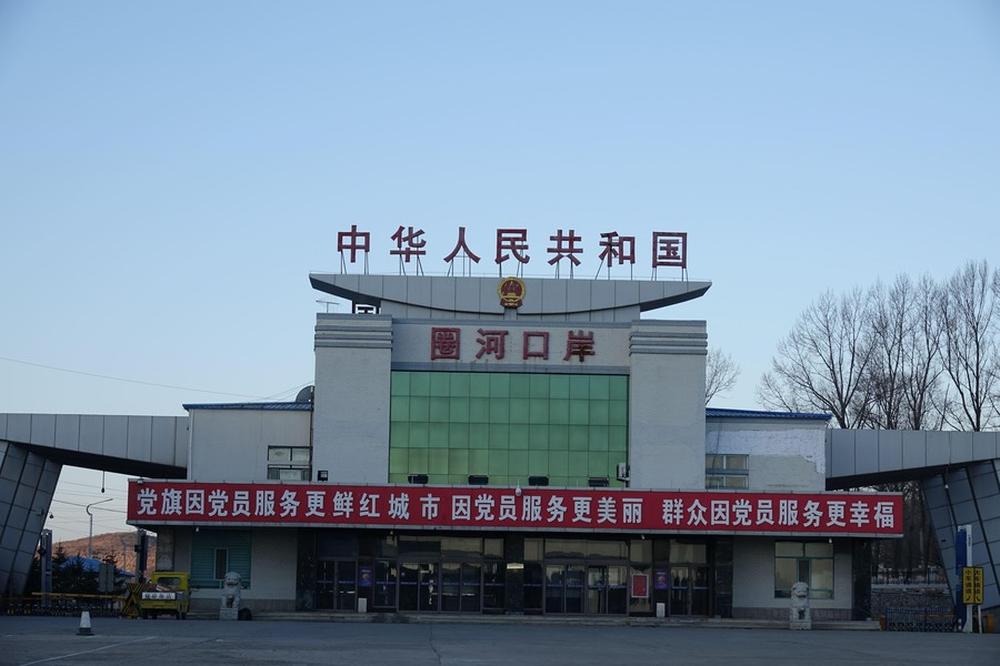
China and North Korea have traditionally maintained close and strategic ties, with China playing a critical role in North Korea's trade. In 2023, China accounted for 98.3% of North Korea’s total trade,[1] underscoring its economic indispensability. However, recent reports of the mass repatriation of North Korean workers[2] and stricter border controls by China[3] hint at potential Sino-North Korean friction. Is this perceived tension in Sino-North Korean relations genuine? This article examines recent trade data, providing evidence that their bilateral economic relationship has yet to fully recover pre-COVID-19 level as expected.
Despite China’s significant presence in North Korea’s economy, an analysis of post-sanction and post-COVID-19 trade data reveals a rather bleak outlook for the Sino–North Korean economic relationship. First, the volume of trade has recently declined, as illustrated in Figure 1. Following the implementation of five UNSC sanctions in 2016 and 2017, the monthly trade volume between the two was effectively halved, dropping from $415 million in 2017 to $217 million in 2018–2019. Given that one of the primary objectives of the UNSC sanctions was to curtail North Korea’s revenue streams, this sharp decline—particularly in exports—is unsurprising. Similarly, North Korea’s self-imposed COVID-19 isolation caused trade volumes to plummet further, a predictable consequence of its stringent border closures. However, the critical issue lies in the sluggish recovery following the border reopening. While trade volumes began to rebound, reaching $195 million in January 2023—surpassing January 2019 levels—this initial recovery failed to meet expectations. The experts on North Korean economy had anticipated a return to at least 2018–2019 trade levels, attributing the previous decline solely to the COVID-19 effect. Yet, as of September 2024, this recovery remains incomplete. In fact, the average monthly trade volume for 2023 and 2024 (up to September) stands at only $180 million, representing 82.9% of the 2018–2019 average. More troubling for North Korea is the observed decline in trade volume in 2024 compared to 2023, signaling persistent challenges in the bilateral economic relationship.
Figure 1: North Korea’s Monthly Trade with China (Jan. 2017 - Sep. 2024)
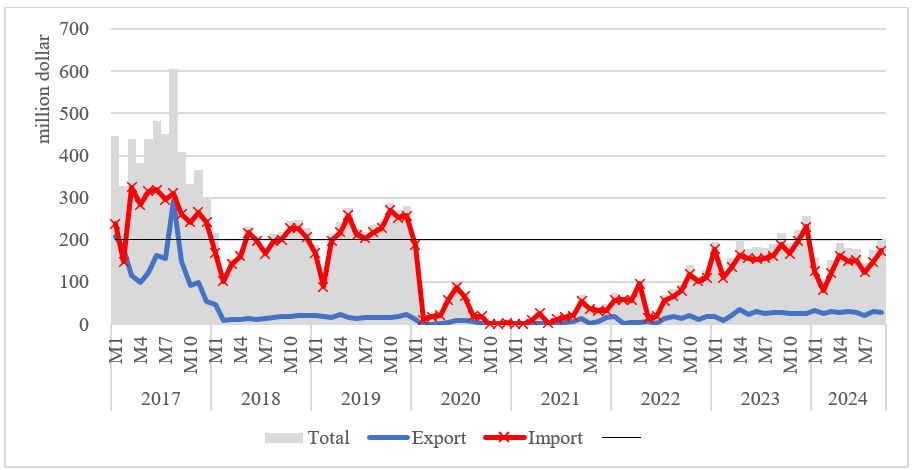
Source: General Administration of Customs of the People’s Republic of China (http://stats.customs.gov.cn/ indexEn, last accessed on October 21, 2024)
Evidence of friction between China and North Korea is also apparent in commodity-level trade data. Tables 1 and 2 compare North Korea’s key export and import commodities from 2018–2019 with those of 2023–2024. During the pre-COVID period of 2018–2019, North Korea exported 198 commodities and imported 867 commodities (on an HS 4-digit basis). However, in 2023–2024, these figures dropped significantly to 109 exported and 708 imported commodities. Although export volumes have increased in the past two years, this growth has been driven primarily by the export of wigs. Excluding wig exports, North Korea’s total export volume for 2023–2024 would be more than halved. On the import side, volumes have declined in the post-COVID period compared to pre-COVID levels, with human hair emerging as the top imported commodity. This shift indicates that processing trade, specifically the production of wigs, has become North Korea’s primary source of trade revenue. Unfortunately for North Korea, processing trade in wigs generates limited value-added benefits, reflecting a low level of economic diversification and industrial capacity. Overall, North Korea’s trade with China has declined not only in volume but also in the diversity of traded goods. Its heavy reliance on the low-value processing trade of wigs since the border reopening underscores the constrained nature of the Sino–North Korean economic relationship.
Table 1: North Korea’s Exports to China – Pre-COVID-19 vs. Post-COVID-19
(Unit: thousand dollar, percent)
|
HS 4-digit |
Commodity |
2018-2019 |
HS 4-digit |
Commodity |
2023-2024 |
||
|
Monthly Average |
Share |
Monthly Average |
Share |
||||
|
9108 |
Watch Movements |
3,346 |
18.75 |
6704 |
Wigs |
14,898 |
57.17 |
|
7202 |
Ferro-alloys |
2,473 |
13.86 |
2611 |
Tungsten |
2,218 |
8.51 |
|
6704 |
Wigs |
2,227 |
12.48 |
7202 |
Ferro-alloys |
2,172 |
8.34 |
|
2611 |
Tungsten |
1,284 |
7.20 |
2716 |
Electrical Energy |
1,819 |
6.98 |
|
9023 |
Exhibition Apparatus |
1,096 |
6.14 |
2613 |
Molybdenum |
828 |
3.18 |
|
9804 |
Personal Exemptions |
1,065 |
5.97 |
9108 |
Watch Movements |
752 |
2.89 |
|
2716 |
Electrical Energy |
951 |
5.33 |
2849 |
Carbides |
455 |
1.75 |
|
2613 |
Molybdenum |
658 |
3.68 |
5002 |
Raw Silk |
334 |
1.28 |
|
7005 |
Float Glass and Surface |
460 |
2.58 |
9804 |
Personal Exemptions |
312 |
1.20 |
|
6406 |
Parts of Footwear |
340 |
1.91 |
7005 |
Float Glass and Surface |
290 |
1.11 |
|
Total (198 Commodities) |
17,849 |
100.00 |
Total (109 Commodities) |
26,058 |
100.00 |
||
Note: The data up to September 2024 are included.
Source: General Administration of Customs of the People’s Republic of China (http://stats.customs.gov.cn/ indexEn, last accessed on October 21, 2024)
Table 2: North Korea’s Imports from China – Pre-COVID-19 vs. Post-COVID-19
(Unit: thousand dollar, percent)
|
HS 4-digit |
Commodity |
2018-2019 |
HS 4-digit |
Commodity |
2023-2024 |
||
|
Monthly Average |
Share |
Monthly Average |
Share |
||||
|
5407 |
Woven Fabrics |
12,286 |
6.15 |
6703 |
Human Hair |
13,671 |
8.86 |
|
1507 |
Soybean Oil |
10,733 |
5.38 |
5407 |
Woven Fabrics |
7,331 |
4.75 |
|
1101 |
Wheat |
5,676 |
2.84 |
1507 |
Soybean Oil |
6,931 |
4.49 |
|
9114 |
Watch Parts |
4,707 |
2.36 |
6006 |
Knitted Fabrics |
4,420 |
2.87 |
|
3102 |
Nitrogenous Fertilizers |
4,612 |
2.31 |
3105 |
Compound Fertilizers |
4,319 |
2.80 |
|
6006 |
Knitted Fabrics |
4,540 |
2.27 |
1006 |
Rice |
4,032 |
2.61 |
|
1006 |
Rice |
4,256 |
2.13 |
3918 |
Plastic Floor Coverings |
3,697 |
2.40 |
|
2403 |
Tobacco |
3,514 |
1.76 |
3004 |
Medicaments |
3,592 |
2.33 |
|
0808 |
Apples, Pears and Quinces |
3,365 |
1.69 |
1701 |
Cane Sugar |
3,466 |
2.25 |
|
6907 |
Ceramic Tiles |
3,263 |
1.63 |
6907 |
Ceramic Tiles |
3,334 |
2.16 |
|
Total (867 Commodities) |
199,617 |
100.00 |
Total (708 Commodities) |
154,241 |
100.00 |
||
Note: The data up to September 2024 are included.
Source: General Administration of Customs of the People’s Republic of China (http://stats.customs.gov.cn/ indexEn, last accessed on October 21, 2024)
It remains uncertain whether China has intentionally curtailed trade with North Korea. Some might attribute the decline in Sino-North Korean trade to China’s recent economic slowdown, which could have indirectly affected bilateral exchanges. Alternatively, North Korea may have sought to address its chronic trade deficit by promoting domestic production and reducing reliance on imports. Another perspective suggests that Russia, with its increasingly close ties to North Korea, could be emerging as an alternative trading partner. However, trade volumes between Russia and North Korea remain significantly lower compared to those between China and North Korea.[4] Regardless of the underlying reasons, the trade data indicates that the current Sino-North Korean economic relationship is not as robust as it once was. Moving forward, it will be essential to monitor developments in trade patterns and broader geopolitical dynamics to fully understand the evolving nature of this critical bilateral relationship.
[1] KOTRA, “North Korea’s External Trade in 2023”, KOTRA Report 24-070, Korea Trade-Investment Promotion Agency, 2024. (in Korean)
[2] Yonhap News Agency, “China believed to demand N. Korea bring back all of its workers: source,” July 9, 2024.
[3] DailyNK, “China moves to intensify controls along border with North Korea”, December 12, 2023.
[4] Russia has not published the official trade statistics since the beginning of the Russia-Ukraine War in 2022. According to the Russian report, the trade turnover in 2023 between Russia and North Korea was $34.4 million, which is about 1.26% of Sino-North Korean trade in 2023.
Jinwook Nam is an associate research fellow at the Korea Development Institute (KDI). Email: jnam@kdi.re.kr. Any opinions, findings, and conclusions or recommendations expressed in this material are those of the author and do not necessarily reflect the views of the KDI.